
The problem
The Auth0 platform had no built-in analytics. To monitor user growth, audit login activity, or spot security anomalies, developers had to export raw data to tools like Splunk or Datadog. For years the official position was that customers should analyze their data in the tool of their choice, but the lack of built-in reporting was hurting analyst ratings and costing renewals. Customers churned over it.
The working hypothesis for the first phase: if we built insights features that helped customers understand how Auth0 is used inside their applications, they’d make more informed business decisions, driving up the value of the service, satisfaction, and retention. To move fast, we partnered with the data team on a common data modeling layer that other product verticals could contribute to, so new tiles and reports wouldn’t each need their own pipeline.
What I did
Research first
Before designing anything, we wrote down the assumptions worth testing: that users would benefit from a fly-by update on the health of their setup (growth, churn, risk, retention); that they’d want metrics on time periods matching their professional calendars; that some metrics were universal while others were role-specific; that security engineers cared most about visualizing their security posture; and that people would want to share what they saw with their org.
We recruited software developers and marketing professionals across customer segments and interviewed them about how they actually work with data. Some assumptions held, others didn’t:
- “Churn” meant something different at every company — bounce rate, health scores, return rates, account deletion, inactivity. A single churn tile would have been wrong for most of them.
- Sharing meant exports, not dashboards: CSV per chart and screenshots for slide decks, not full data dumps.
- Trust required transparency: automatic trend detection, a last-refreshed timestamp, and the ability to drill into spikes to understand why.
The biggest reframing: users didn’t want a reporting dashboard. They wanted charts as navigation.
Charts are an entry point. I get the high-level view, then drill into logs for the specific time window.
Extending the design language
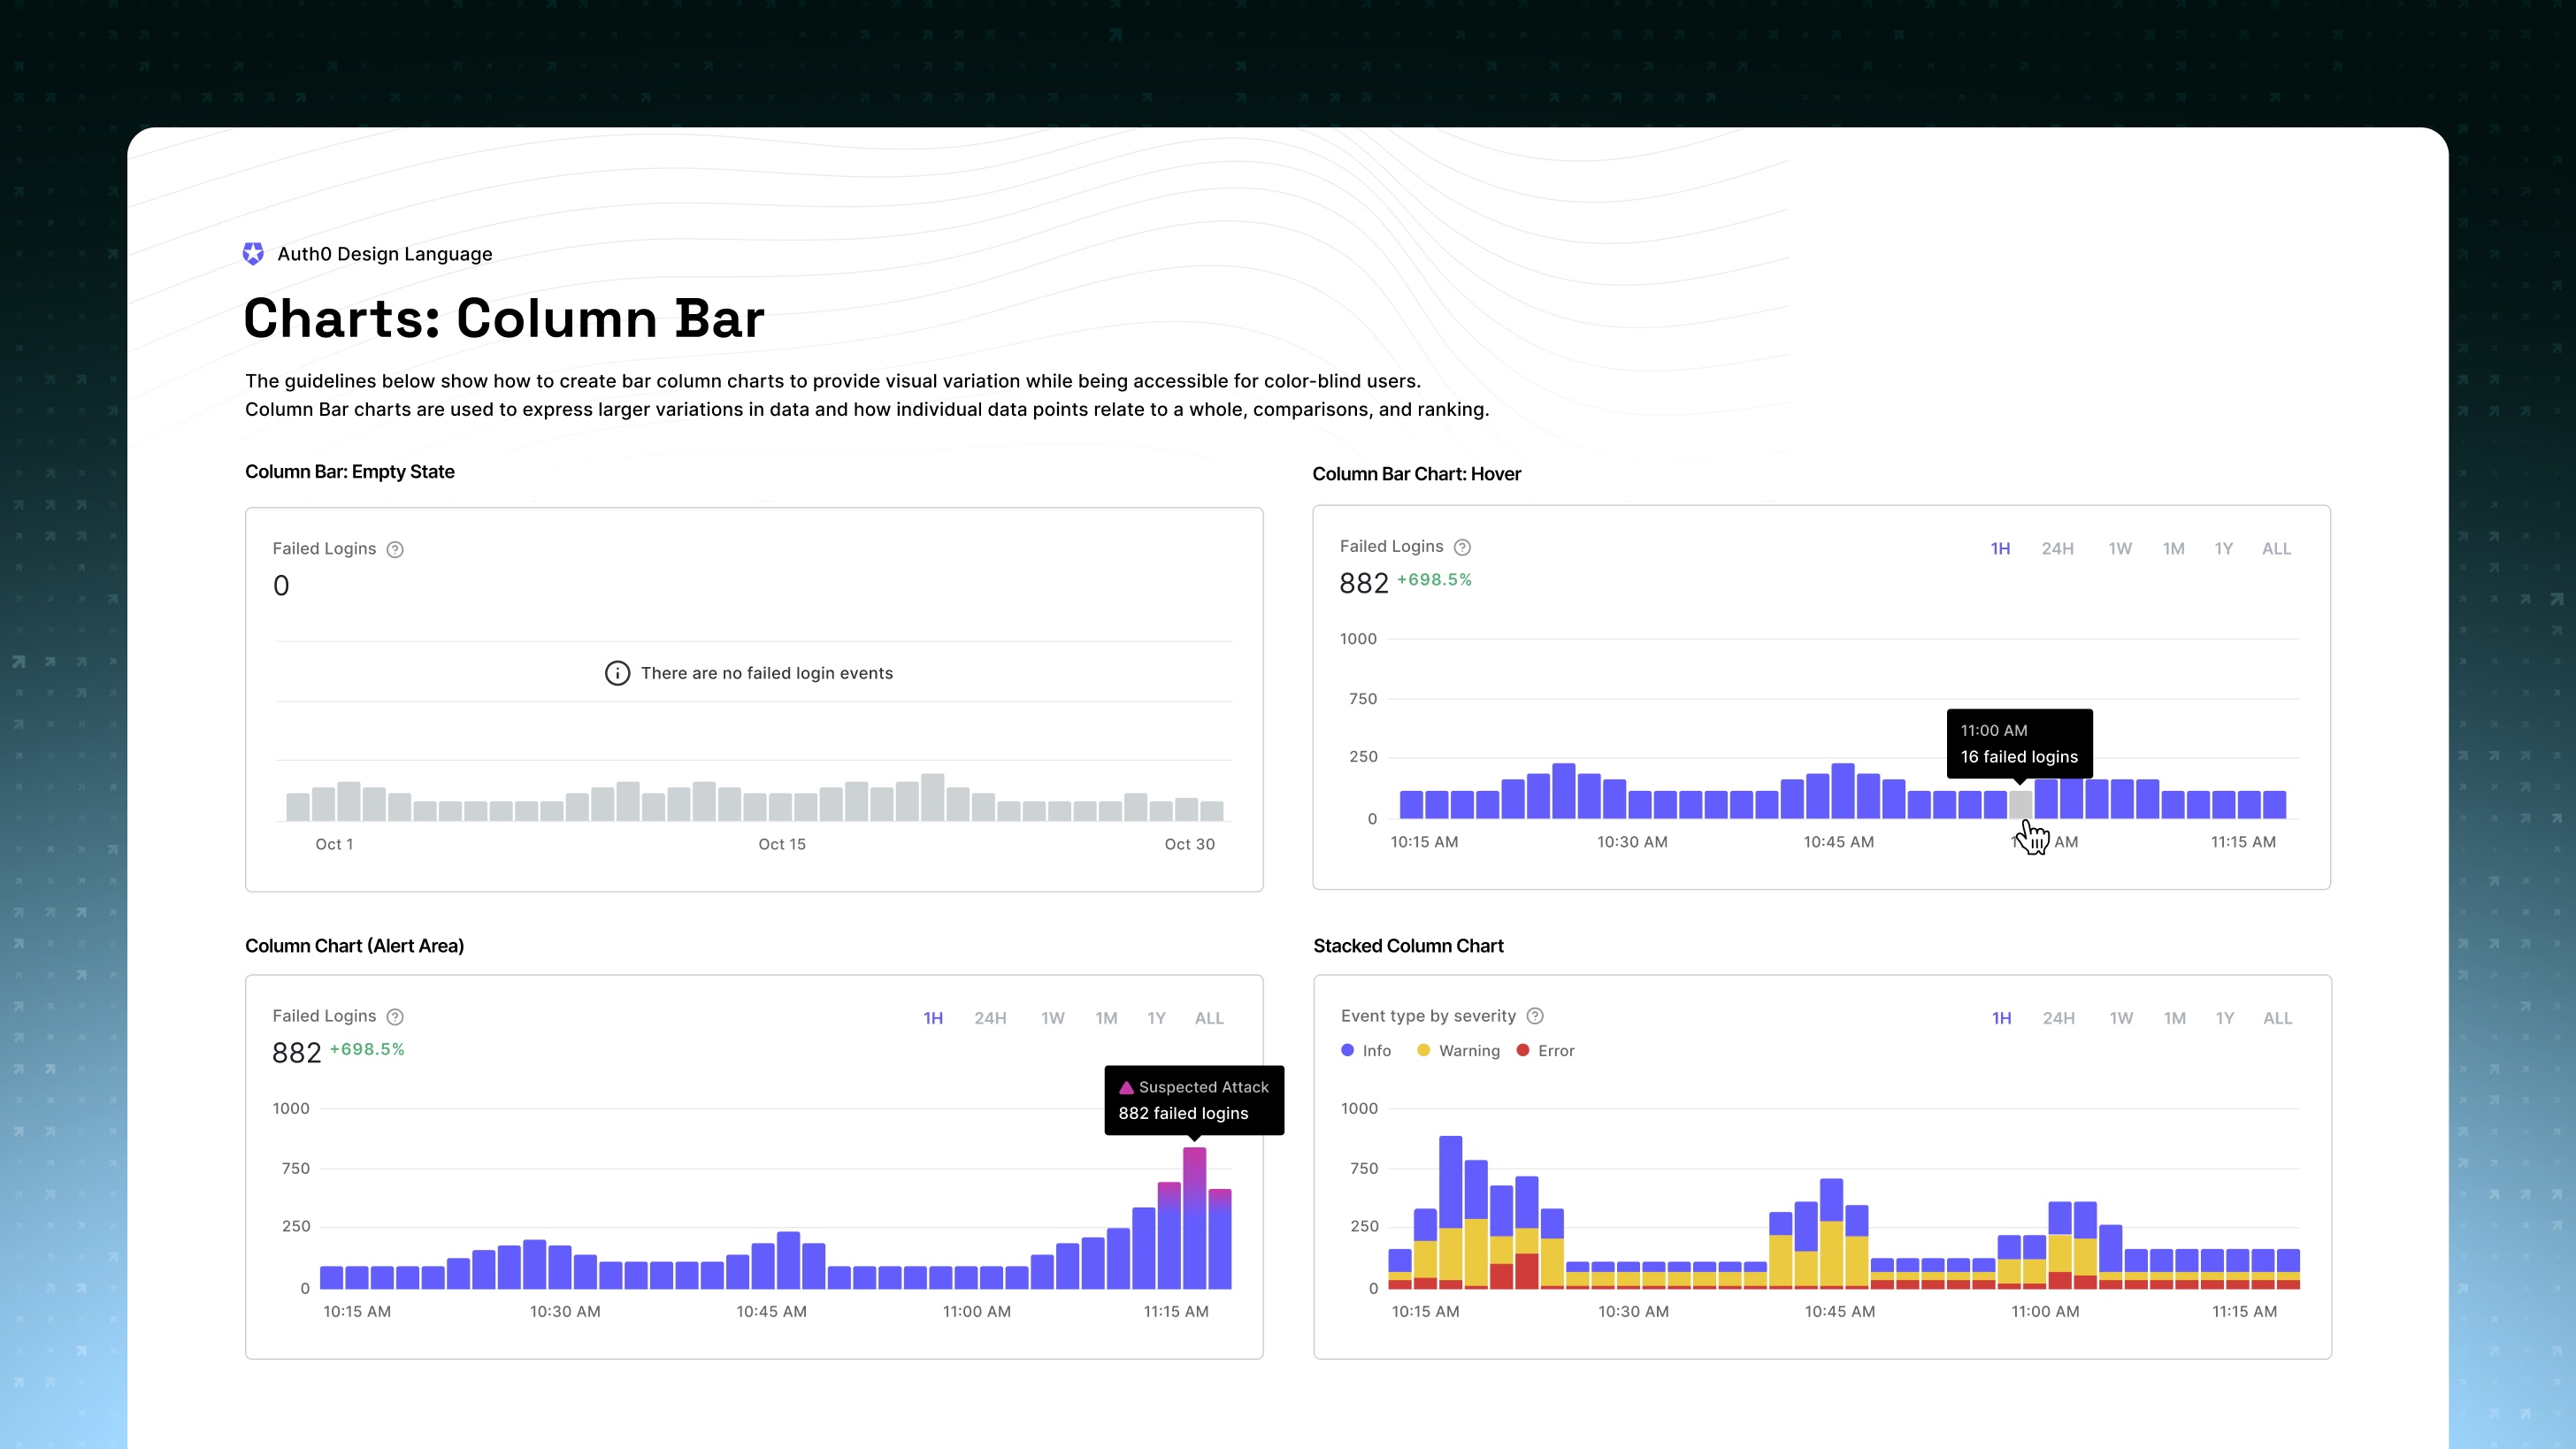
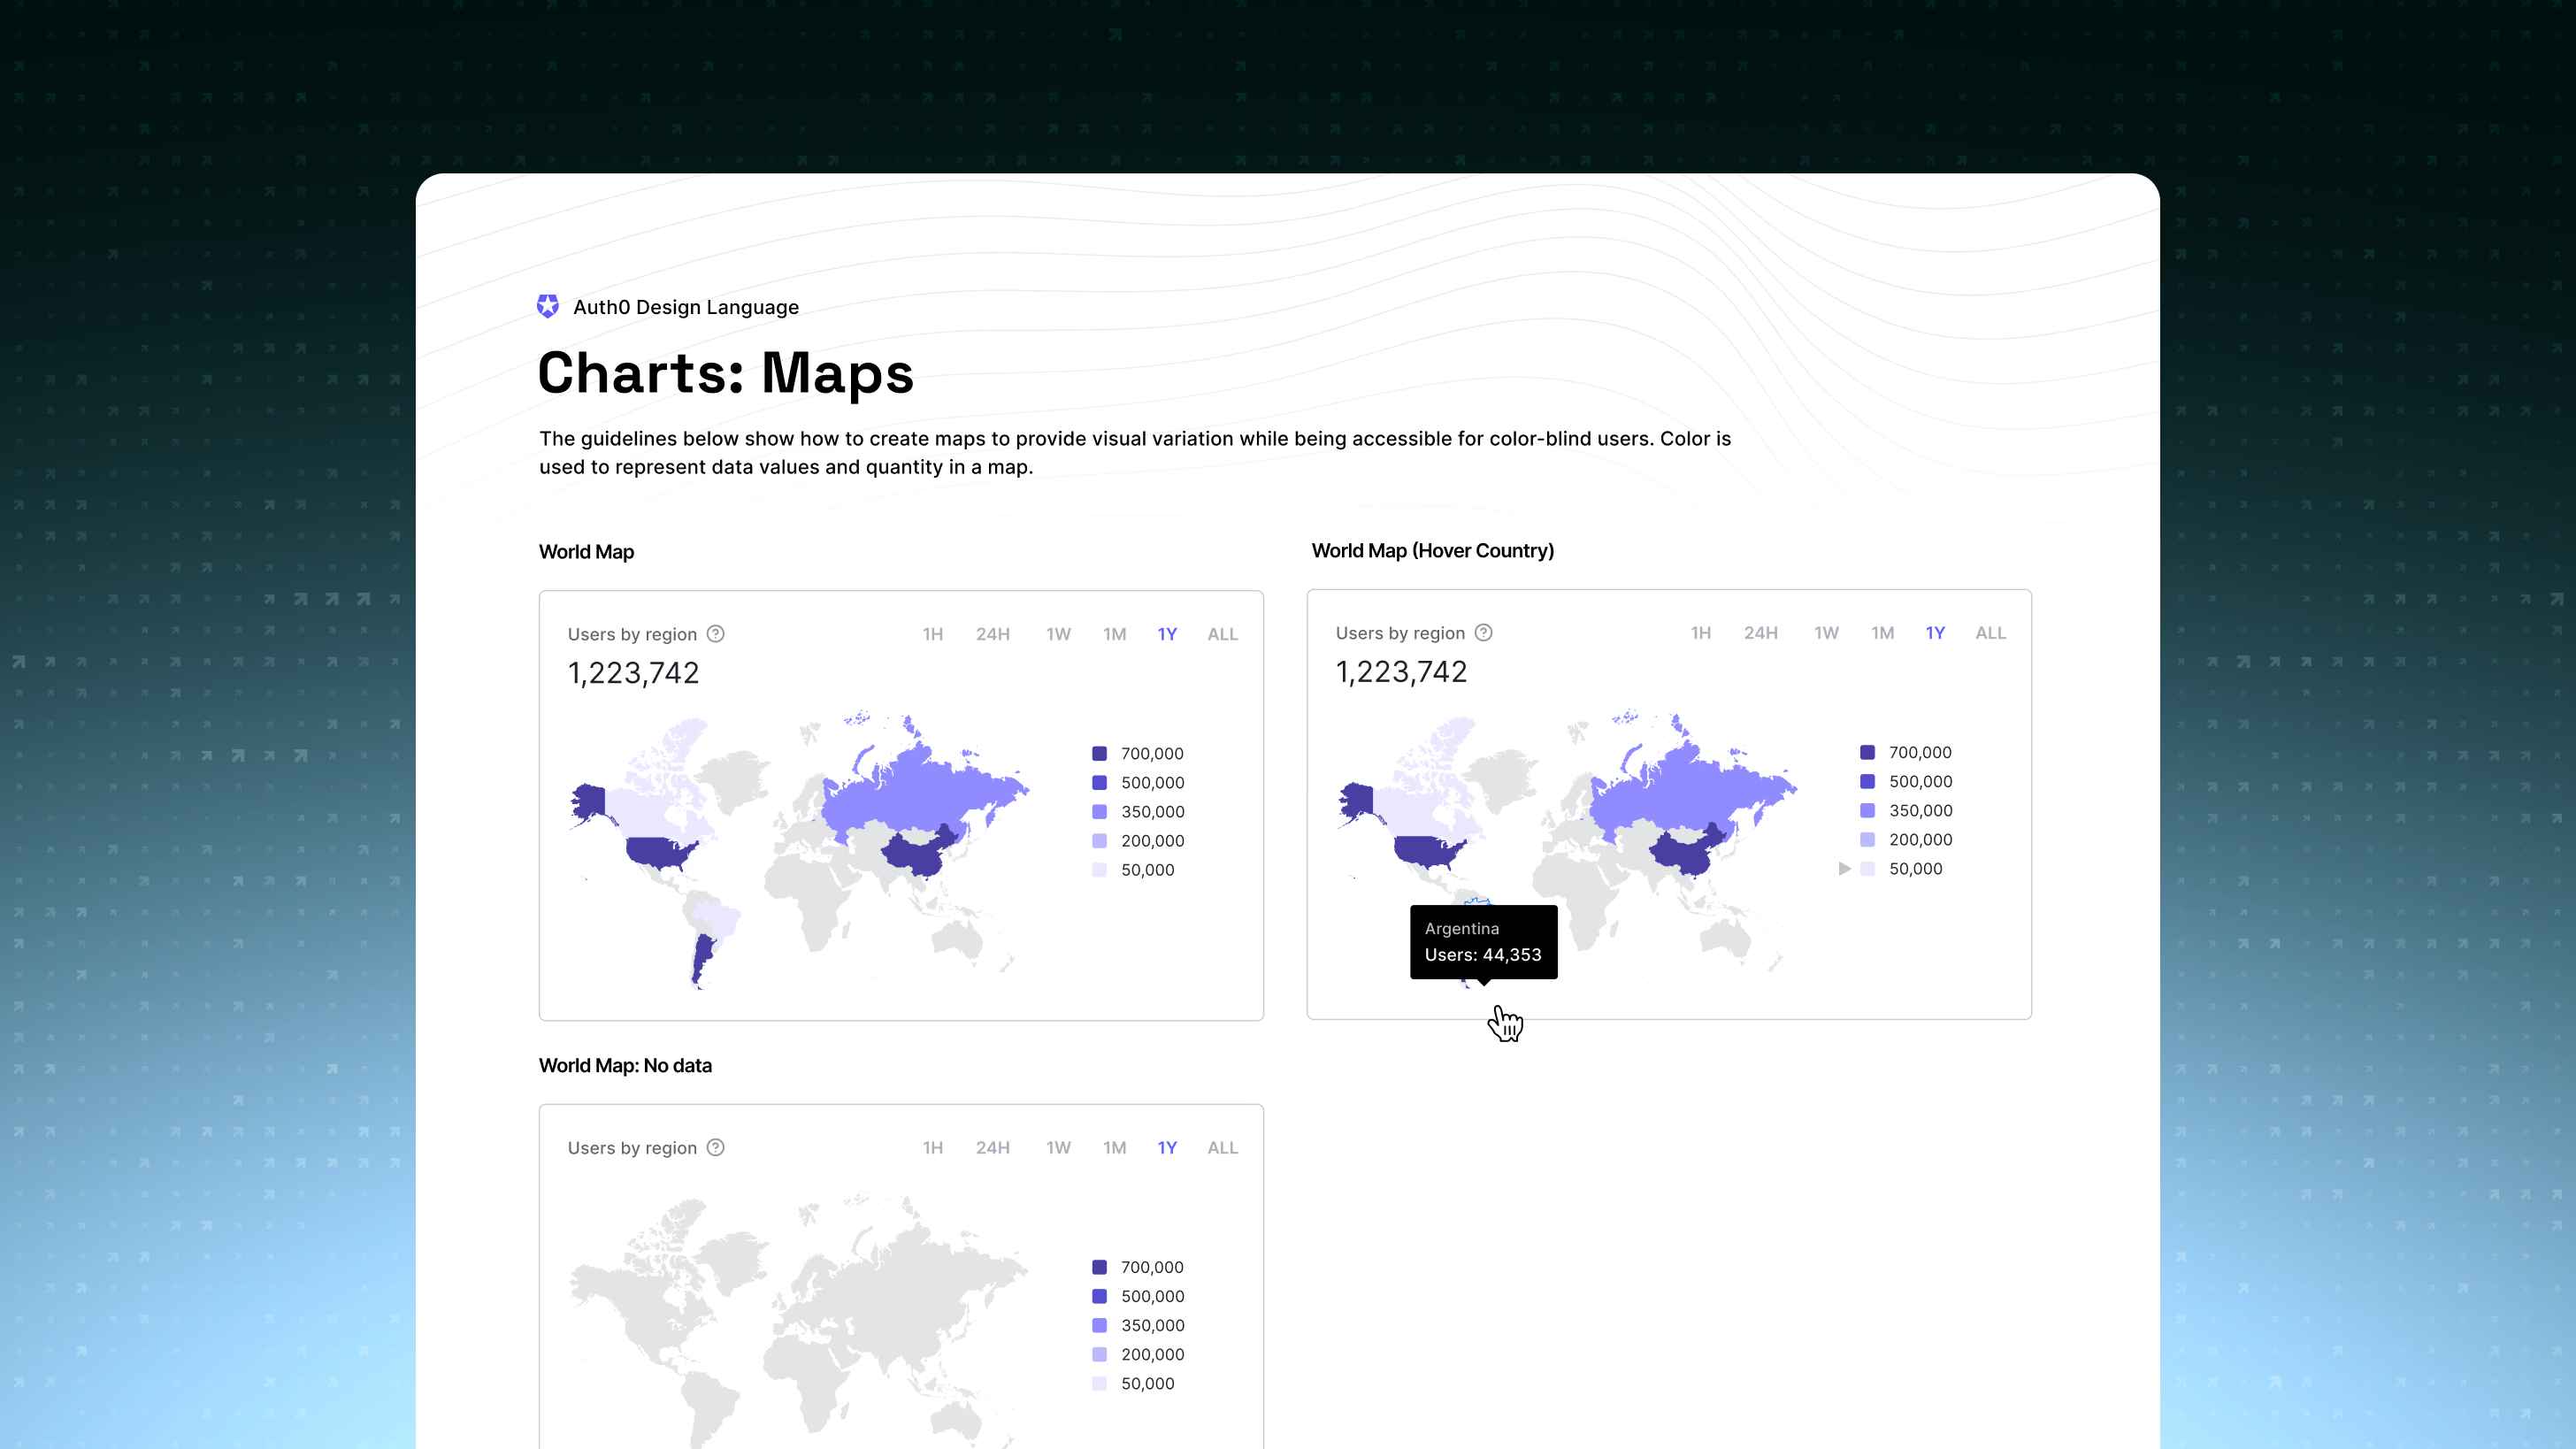
Auth0 had barely used data visualization before, so the early sprints were spent on chart foundations in isolation: collecting UI references and competitive research, defining color palettes and grouping, testing for accessibility, and pressure-testing a charting library against the design system. From there I defined the base styles: bar, line, scatter, maps, tooltips, hover states, and the edge cases in between.
The page itself
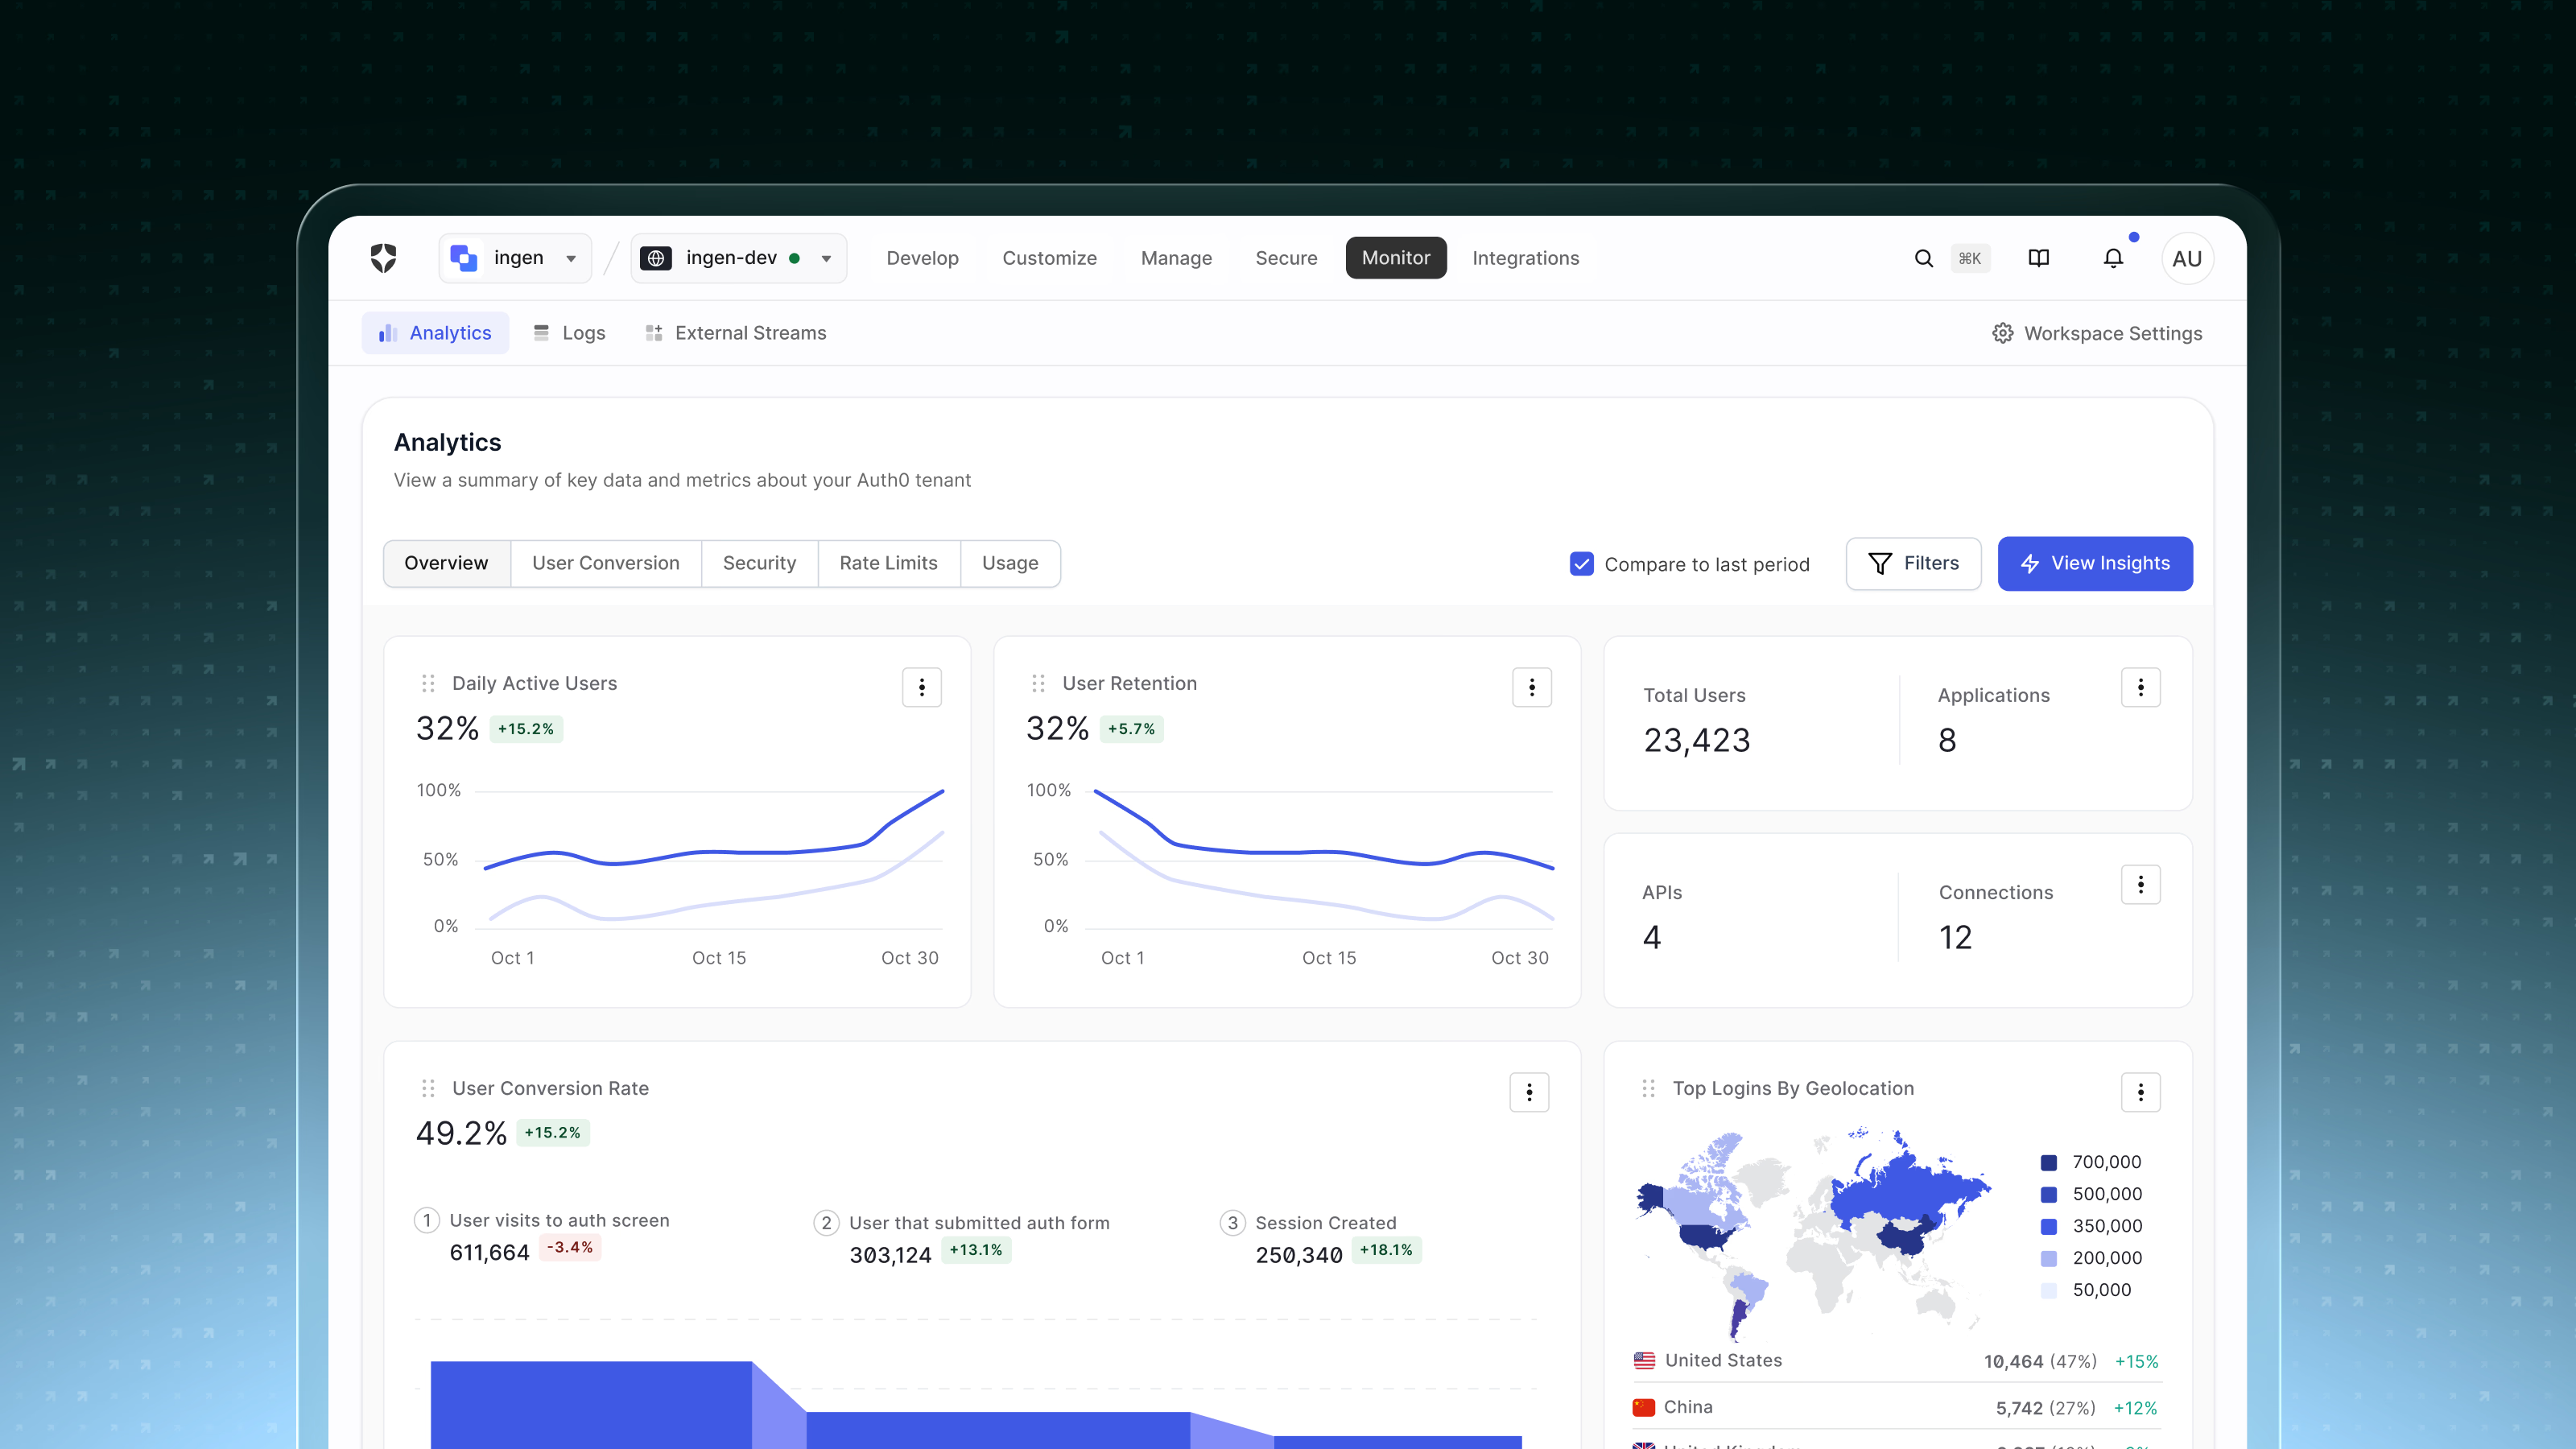
The Overview section kept the at-a-glance snapshot users already relied on — total users, applications, APIs, and connections. Comparisons answered the most consistent research signal: people don’t read snapshots, they contrast periods. A date picker offered 7, 14, 30, and 60-day windows plus custom ranges, and percentage-shift indicators set the threshold for attention: “If it’s less than 1–2% I won’t care. If it’s 50%, I’ll investigate.” Chart metadata was made persistable and shareable, because security teams routinely needed to loop in colleagues mid-investigation.
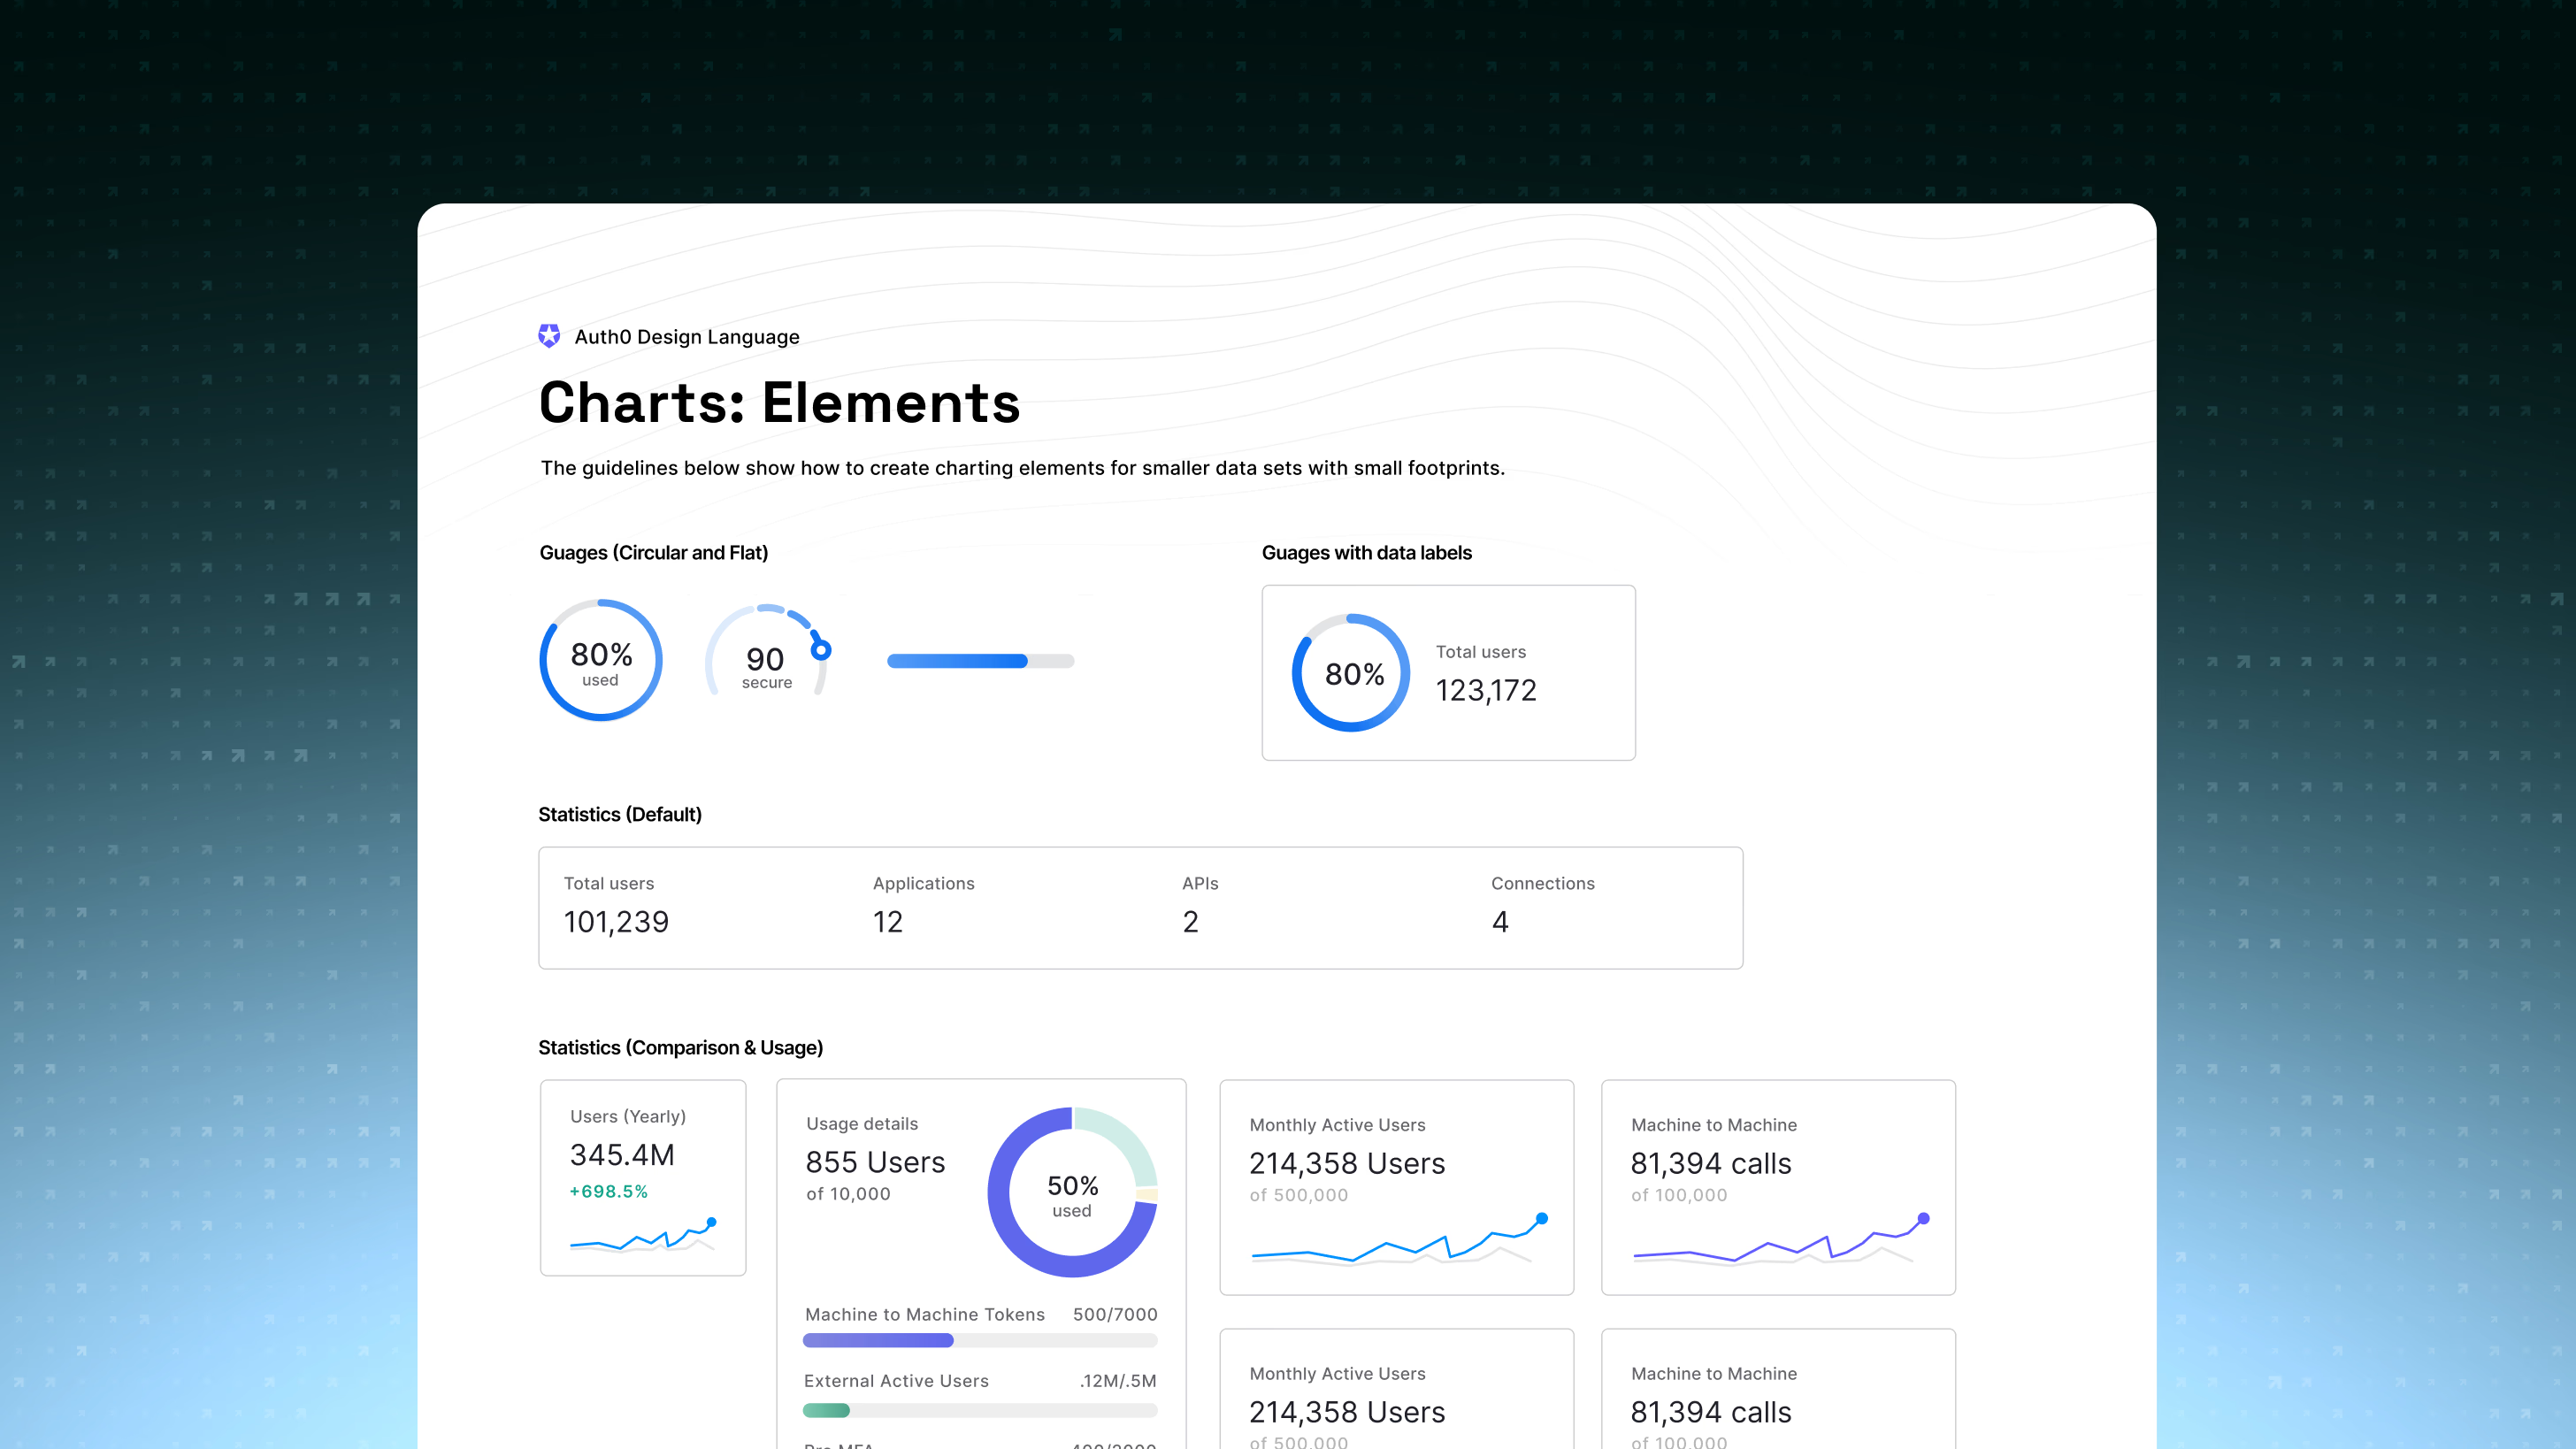
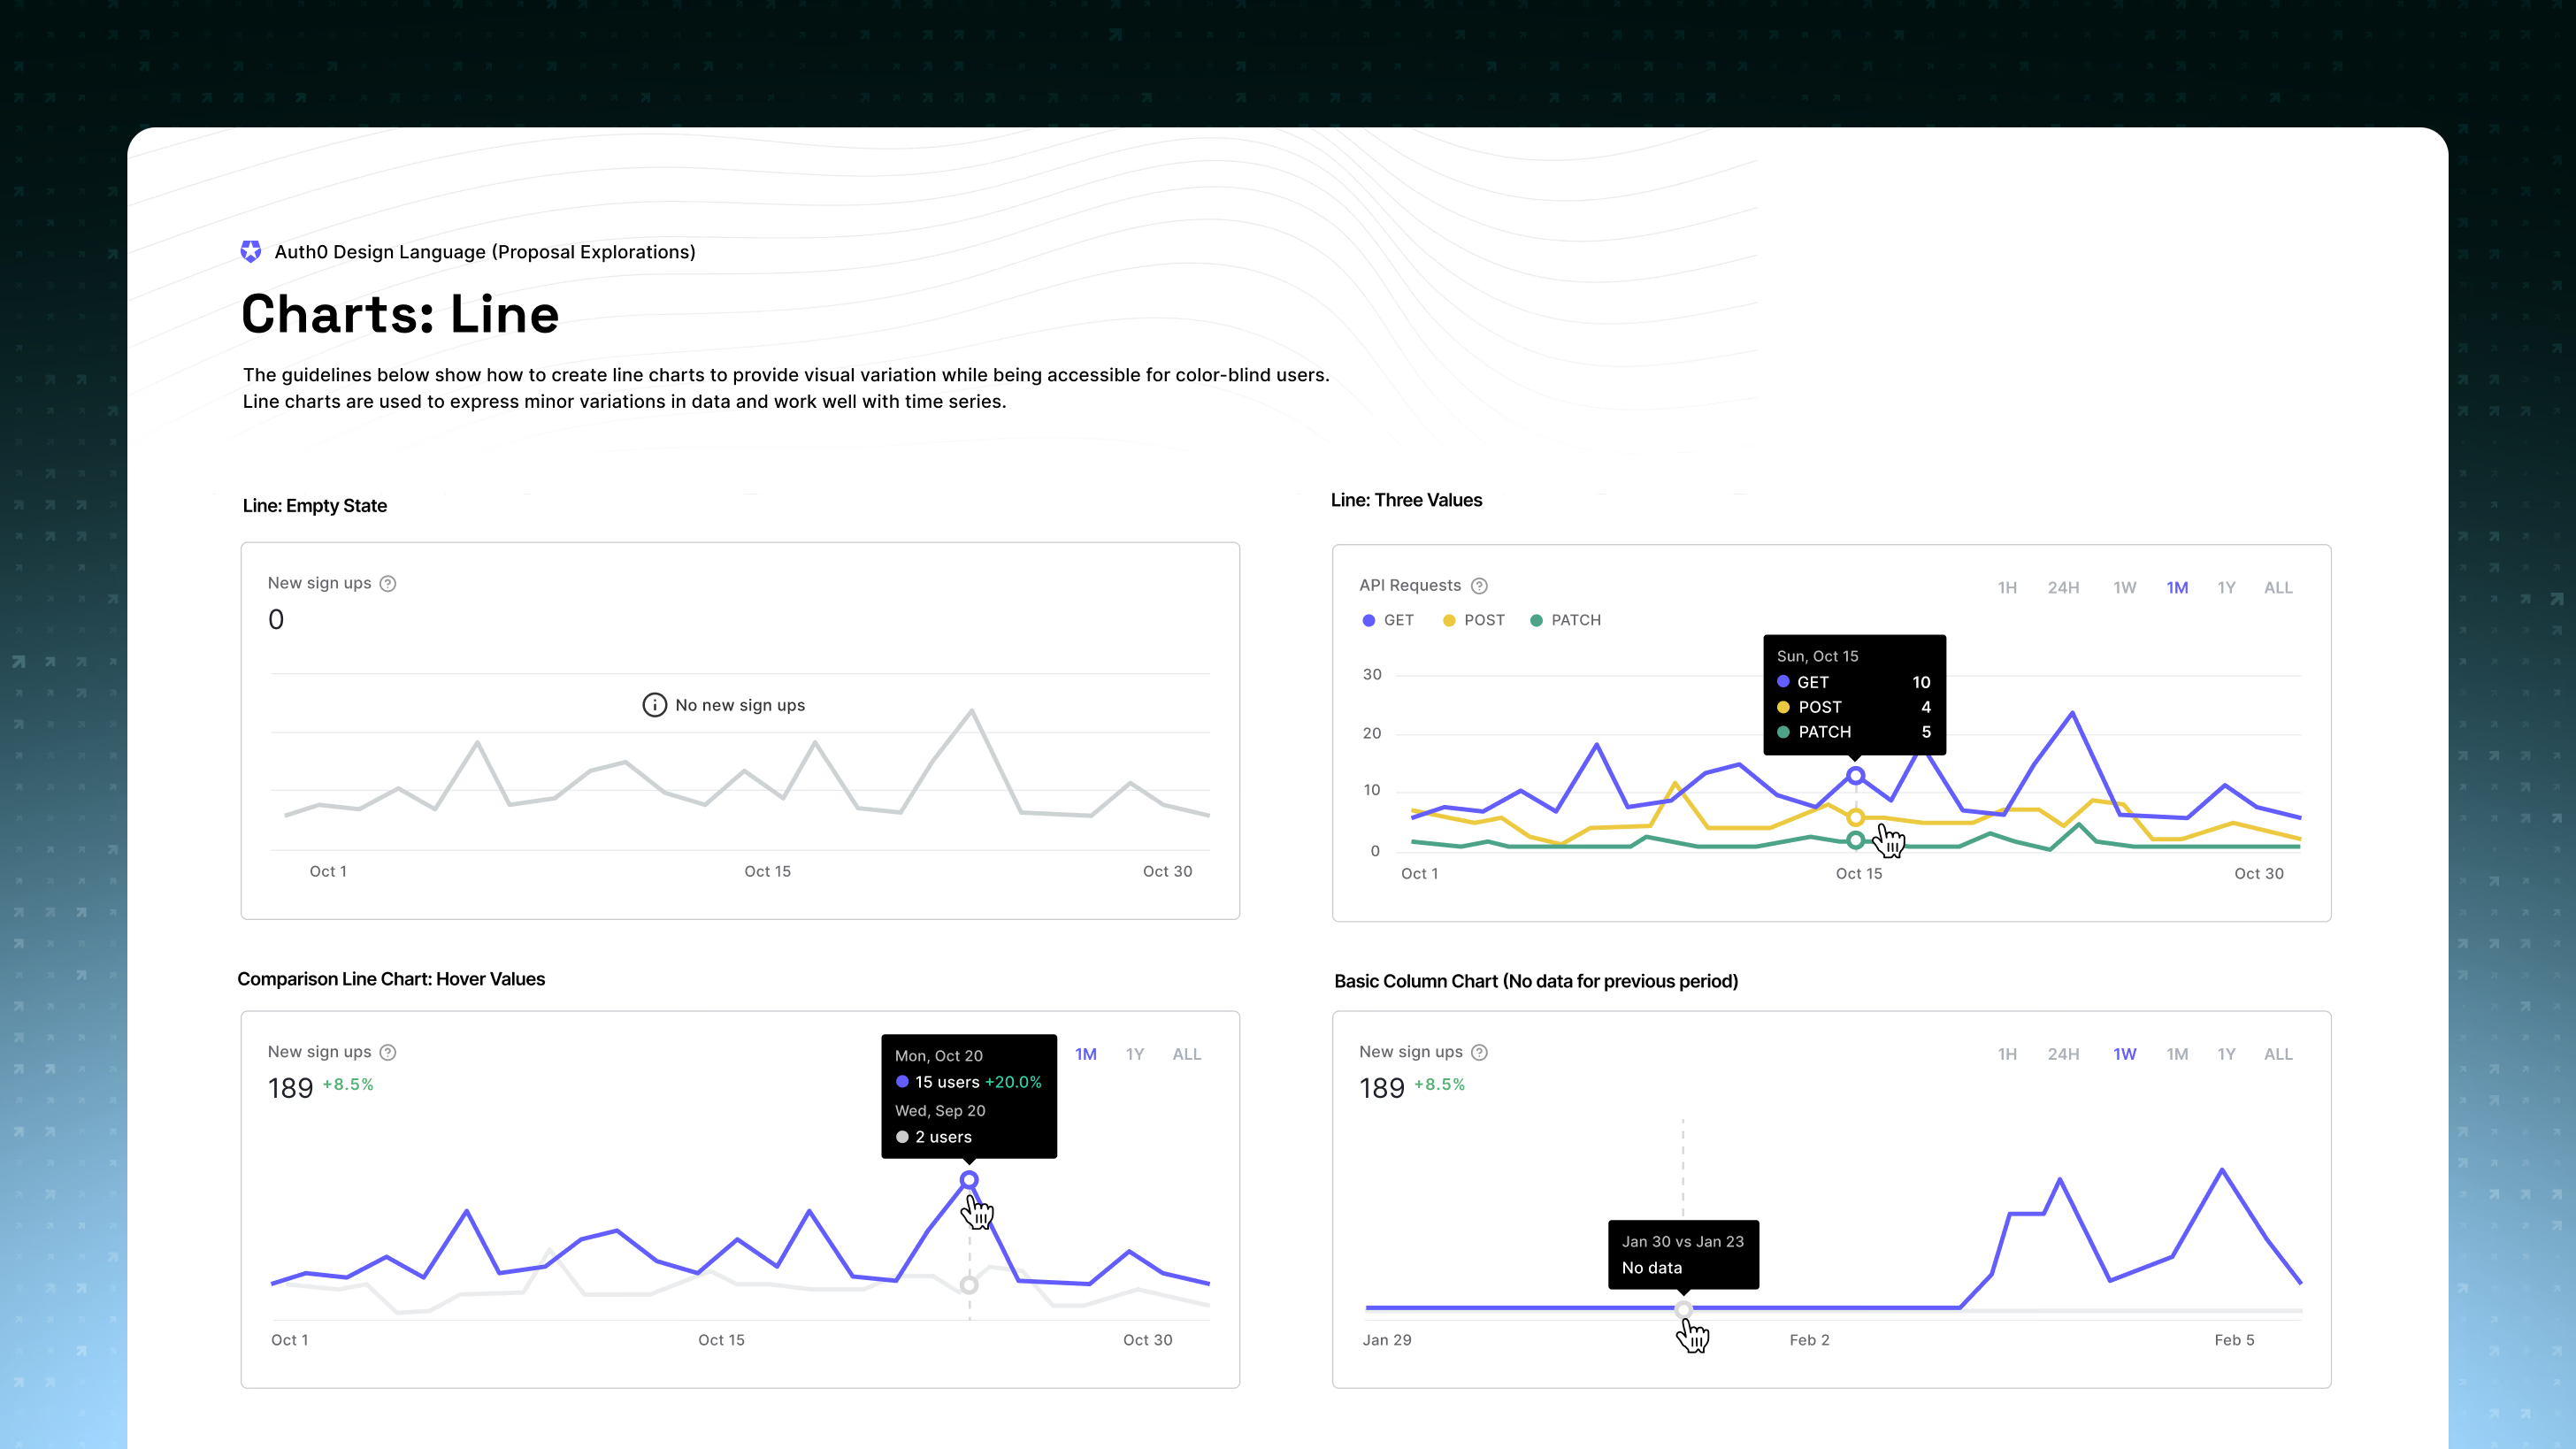
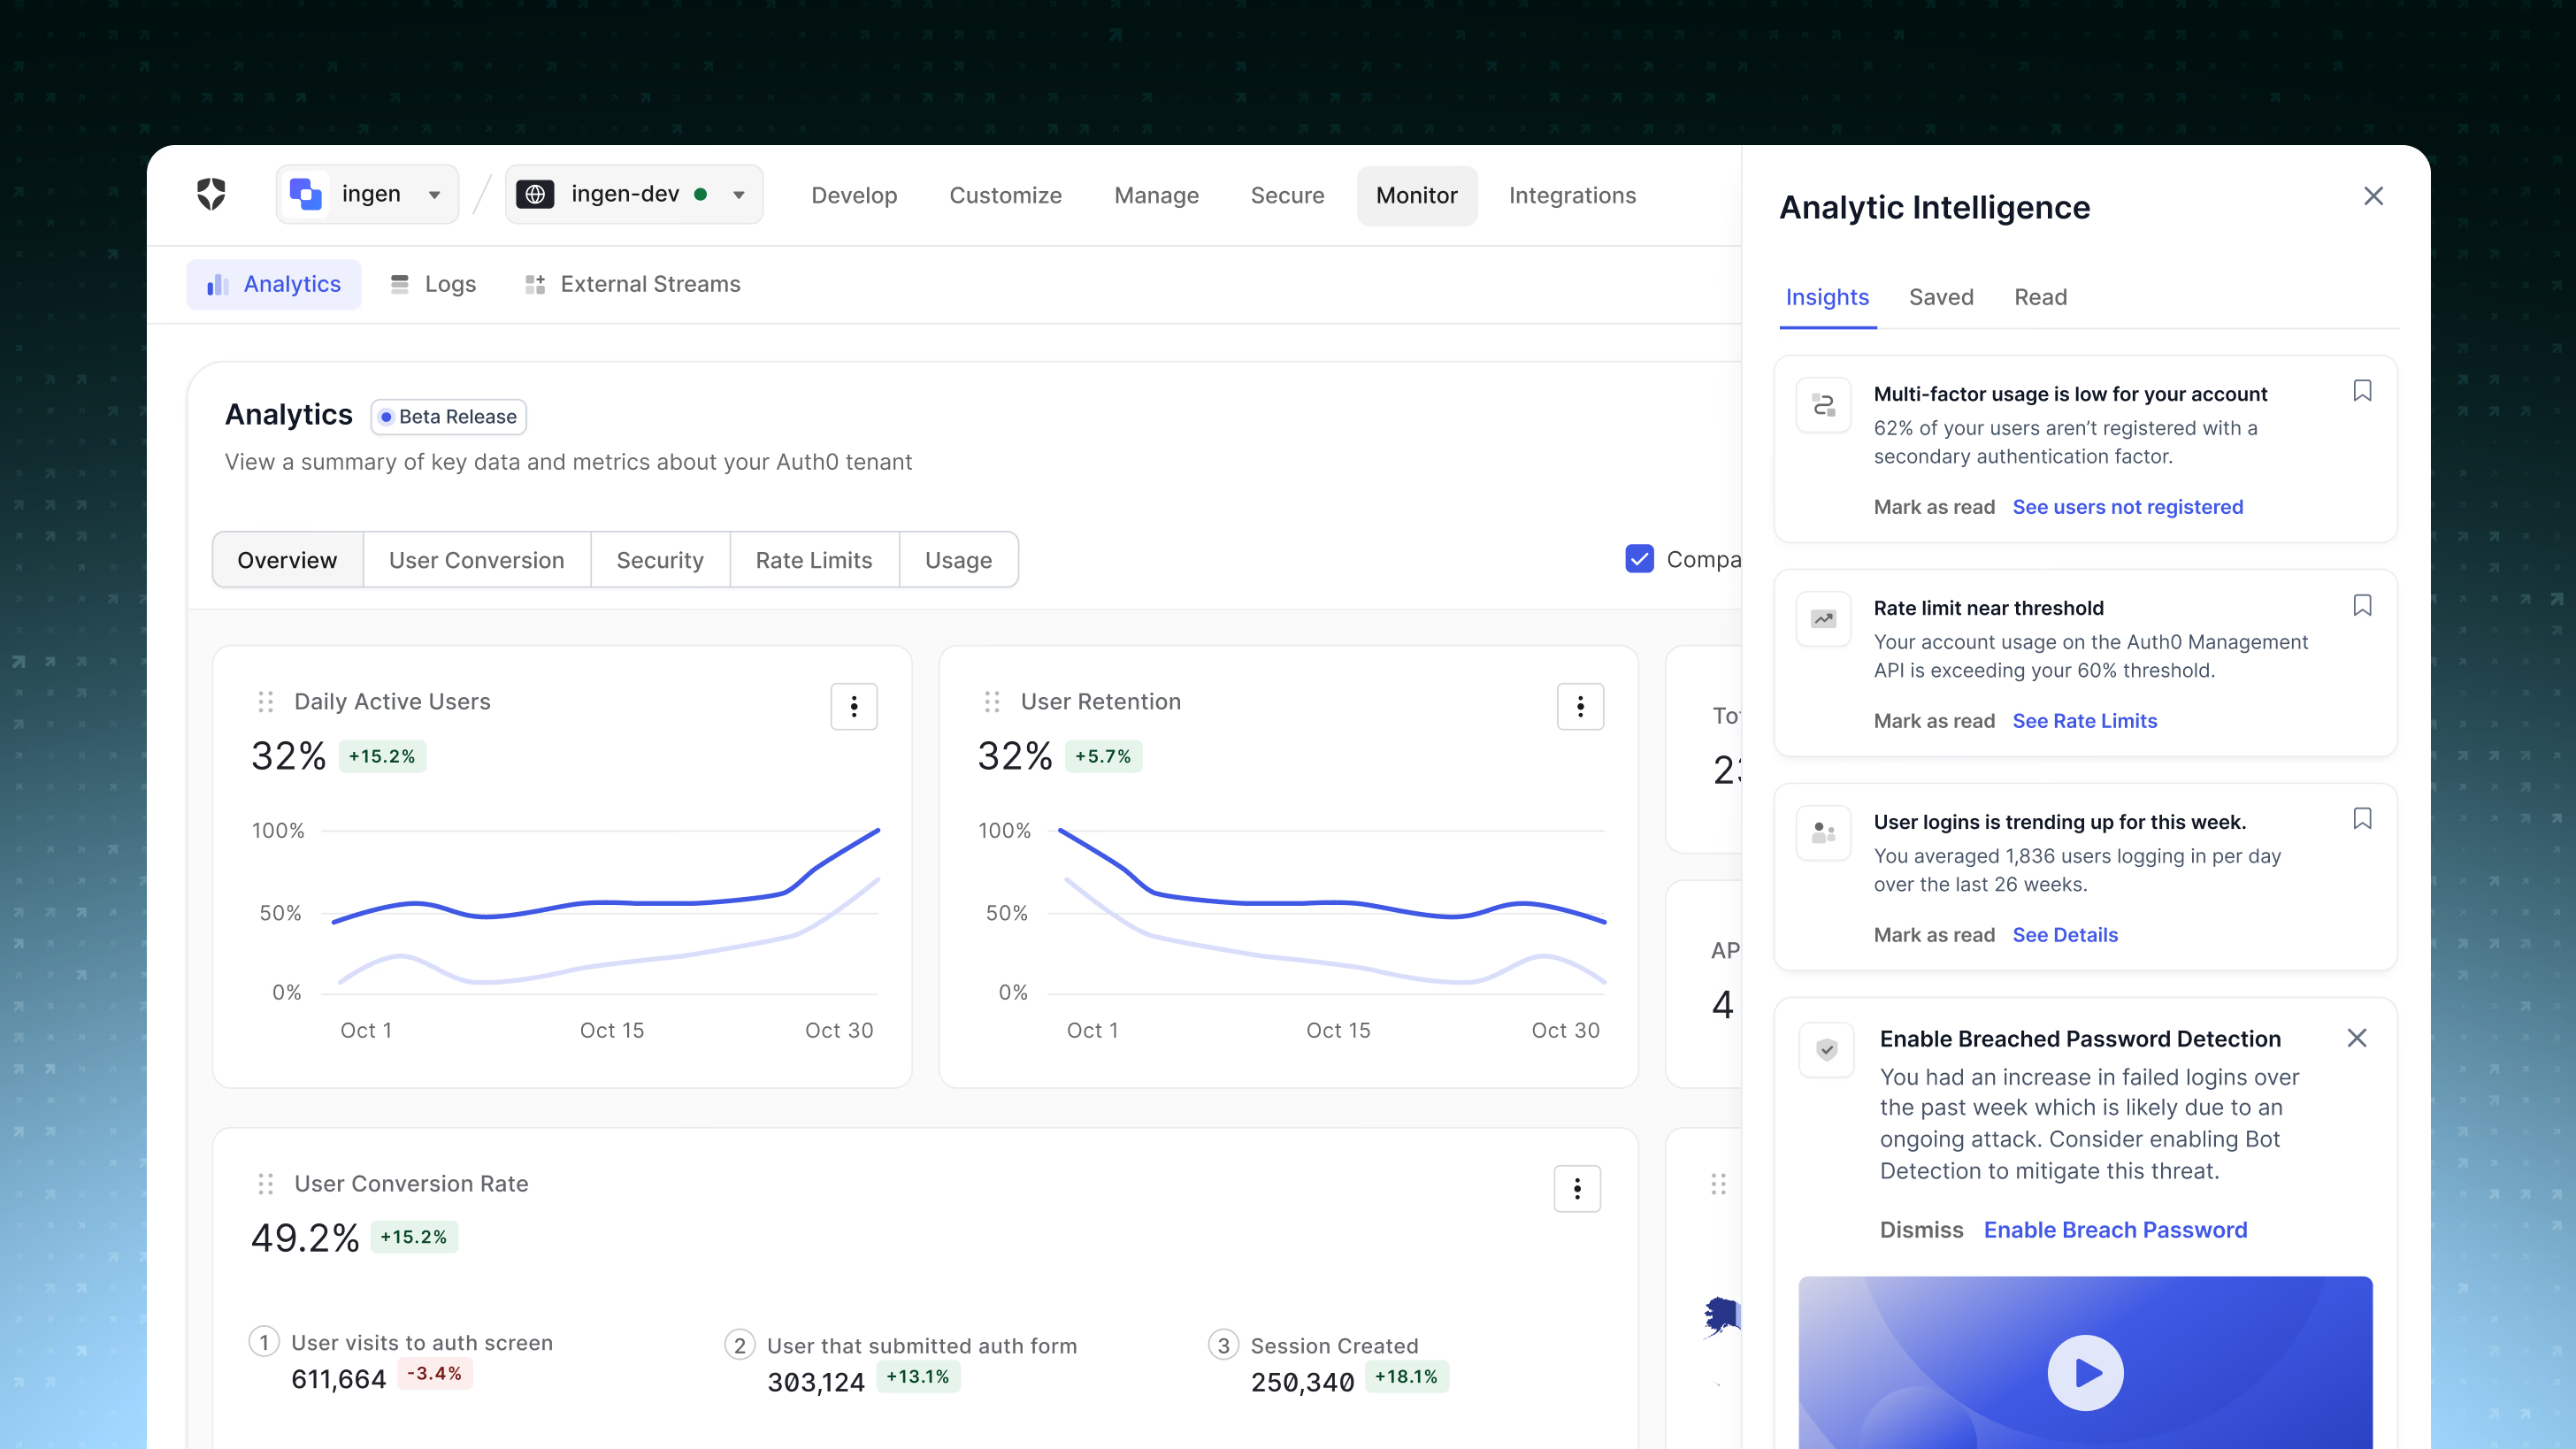
The chart components shipped as a design-system contribution, setting the accessible visual standard for all future data features across the platform.
The outcome
- 75%+ positive sentiment among developers in post-launch surveys
- 800+ survey responses within the first few weeks, well above baseline
- Chart component library adopted into the company’s global design system as the foundation for all future data products
The first phase also set the roadmap for what came next: usage and security charts, filtering by event type, exportable reports, and surfacing actionable insights rather than just data.